Exclusion limits#
Any Spey statistical model can compute the exclusion confidence level using three different calculators. The availability of these options depends on the functions used in the likelihood construction (see this section for details).
The exclusion limits can be calculated using two different test statistics. The first is the standard profile likelihood ratio:
Interpretation: When \(\hat{\mu} > \mu\) (data prefer even larger signal), the test statistic is zero because there is no tension between the data and the hypothesis. The numerator uses the profile \(\theta_\mu\) (nuisances optimized at fixed \(\mu\)), while the denominator uses the global maximum \((\hat{\mu}, \hat{\theta})\). This test statistic allows negative signal strengths, which is appropriate when negative contributions can occur (e.g., interference effects in EFT).
The alternate test statistic is designed for cases where the signal strength must be non-negative:
Interpretation: The key difference is in the denominator when \(\hat{\mu} < 0\) (data prefer negative signal):
For \(q_\mu\): The denominator is at the (unphysical) negative \(\hat{\mu}\)
For \(\tilde{q}_\mu\): The denominator is at \(\mu=0\) (background-only), treating negative fits as evidence for background-only hypothesis
By default, exclusion_confidence_level() uses the alternate test statistic \(\tilde{q}_\mu\)
(appropriate for physical cross-sections which are always non-negative). This can be changed via the allow_negative_signal
boolean argument to use \(q_\mu\) instead, which is appropriate for EFT scenarios where interference can make effective signals negative.
The exclusion_confidence_level() function allows users to specify the calculator through the calculator keyword, offering three options:
“asymptotic”: Uses asymptotic formulae from the CLs method (see ref. [1] for details). The p-values are computed using the formula:
\[ p_{s+b} = \Phi\left(-\sqrt{\tilde{q}_\mu}\right), \quad p_b = \Phi\left(-\frac{\sqrt{\tilde{q}_\mu} - \sqrt{\tilde{q}_{\mu,A}}}{\text{sensitivity}}\right) \]where \(\tilde{q}_{\mu,A}\) is the test statistic evaluated on Asimov data (measures expected sensitivity), and the asymptotic normal approximation is applied. This is the most commonly used method in LHC analyses because it is computationally fast and theoretically well-understood.
“toy”: Relies on the likelihood’s sampling functionality. It calculates p-values by:
Generating \(N_{\rm toy}\) pseudo-datasets from the signal+background hypothesis at the tested \(\mu\)
Generating \(N_{\rm toy}\) pseudo-datasets from the background-only hypothesis (\(\mu=0\))
Computing the test statistic for each pseudo-dataset
Building empirical CDFs from the toy distributions
Computing p-values as the fraction of toys with test statistics at least as extreme as observed This method is more computationally expensive but makes fewer assumptions about the underlying distributions.
“chi_square”: A simplified Tevatron-era approach that directly uses the chi-squared distribution. The test statistic is \(t_\mu = \sqrt{\tilde{q}_{\mu=1}} - \sqrt{\chi^2_{\text{crit}}}\) where the denominator compares signal+background to background-only. This method does not require the Asimov likelihood and is useful as a quick diagnostic, though it is generally less accurate than the asymptotic method.
The expected keyword allows users to select between computing observed or expected exclusion limits:
Observed limits (observed):
Uses the actual experimental data \(n^i\) in the likelihood. The test statistic \(\tilde{q}_\mu\) is evaluated
on the real data, not on Asimov data. This reflects what the experiment has actually observed and returns a single value.
Post-fit expected limits (aposteriori):
Assumes the background-only hypothesis is true and generates an Asimov dataset at \(\mu=0\) to fit the model.
Expected exclusion limits are then computed at five discrete “sigma levels”: \(n = -2, -1, 0, +1, +2\).
These correspond to quantiles of the background-only test statistic distribution, providing a “Brazil band” that
shows the expected sensitivity and its uncertainty. The return is a list of five values:
\([-2\sigma, -1\sigma, 0, +1\sigma, +2\sigma]\).
Pre-fit expected limits (apriori):
Ignores experimental data entirely and uses background yields as the “observation”. This computes expected limits
based purely on simulated Standard Model (SM) background predictions, useful for theory groups to estimate discovery
potential independent of actual experimental results. Also returns five values.
Mathematical details:
For expected limits, the test statistic is computed at each sigma level by generating Asimov data at \(\mu=0\) with
the background fluctuated by \(n\) standard deviations. The five resulting p-values form the “Brazil band” in exclusion limit plots.
The observed limit returns a single value. The "chi_square" calculator is an exception—it only provides one value for both observed and expected limits.
The allow_negative_signal keyword controls which test statistic is used and how the parameter of interest (POI) is constrained:
When allow_negative_signal=True (uses \(q_\mu\)):
The signal strength \(\mu\) is allowed to take any real value, including negative values
Appropriate for scenarios where the signal can have negative contributions (e.g., interference effects in EFT)
During optimization, nuisance parameters and \(\mu\) are profiled without lower bounds
Results in the standard profile likelihood ratio test
When allow_negative_signal=False (uses \(\tilde{q}_\mu\)):
The signal strength is constrained to \(\mu \geq 0\) during optimization
Appropriate for physical cross-sections and rates, which must be non-negative
The test statistic changes its denominator when the unconstrained fit yields \(\hat{\mu} < 0\) (see definition of \(\tilde{q}_\mu\) above)
This is the default and recommended choice for most particle physics analyses
(For further details, see [1, 2].)
For complex statistical models, optimizing the likelihood can be challenging and depends on the choice of optimizer. Spey uses SciPy for optimization and fitting tasks. Any additional keyword arguments not explicitly covered in the exclusion_confidence_level() function description are passed directly to the optimizer, allowing users to customize its behavior through the interface.
Below we compare the exclusion limits computed with each approach. This comparisson uses normal distribution for the likelihood (default.normal) background yields are set to \(n_b\), uncertainties are shown with \(\sigma\) and observations are given with \(n\).
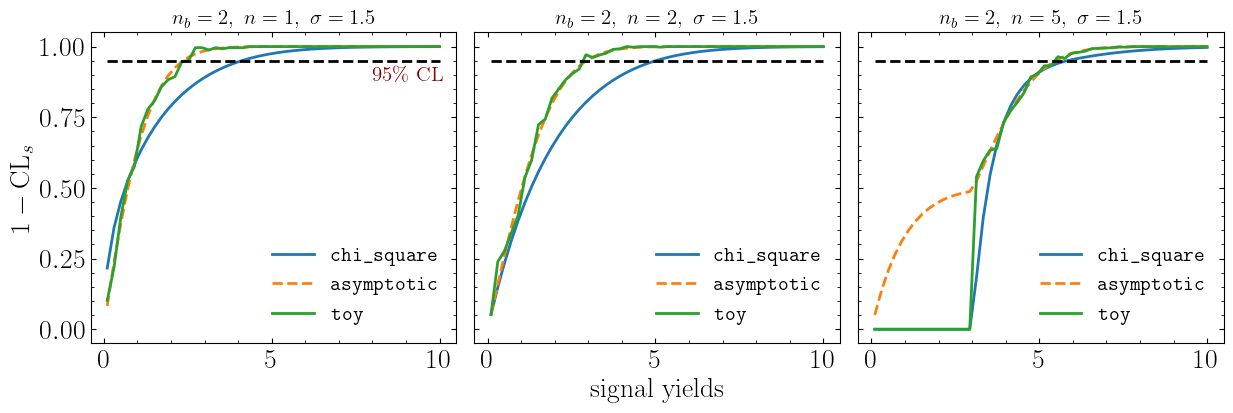
exclusion limit calculator comparisson for observed p-values#
Example:
import spey

stat_wrapper = spey.get_backend("default.normal")
statistical_model = stat_wrapper(
    signal_yields=[3.0],
    background_yields=[2.0],
    absolute_uncertainties=[1.5],
    data=[2],
)

print(f"1-CLs value with calculator='asymptotic': {statistical_model.exclusion_confidence_level()[0]:.3f}")
print(f"1-CLs value with calculator='chi_square': {statistical_model.exclusion_confidence_level(calculator='chi_square')[0]:.3f}")
print(f"1-CLs value with calculator='toy': {statistical_model.exclusion_confidence_level(calculator='toy')[0]:.3f}")
1-CLs value with calculator='asymptotic': 0.954
1-CLs value with calculator='chi_square': 0.811
1-CLs value with calculator='toy': 0.965